 Falmouth MA · Module 1Fig. 06 · Board Game · 2024
Master Your Focus.
Falmouth MA · Module 1Fig. 06 · Board Game · 2024Master Your Focus.
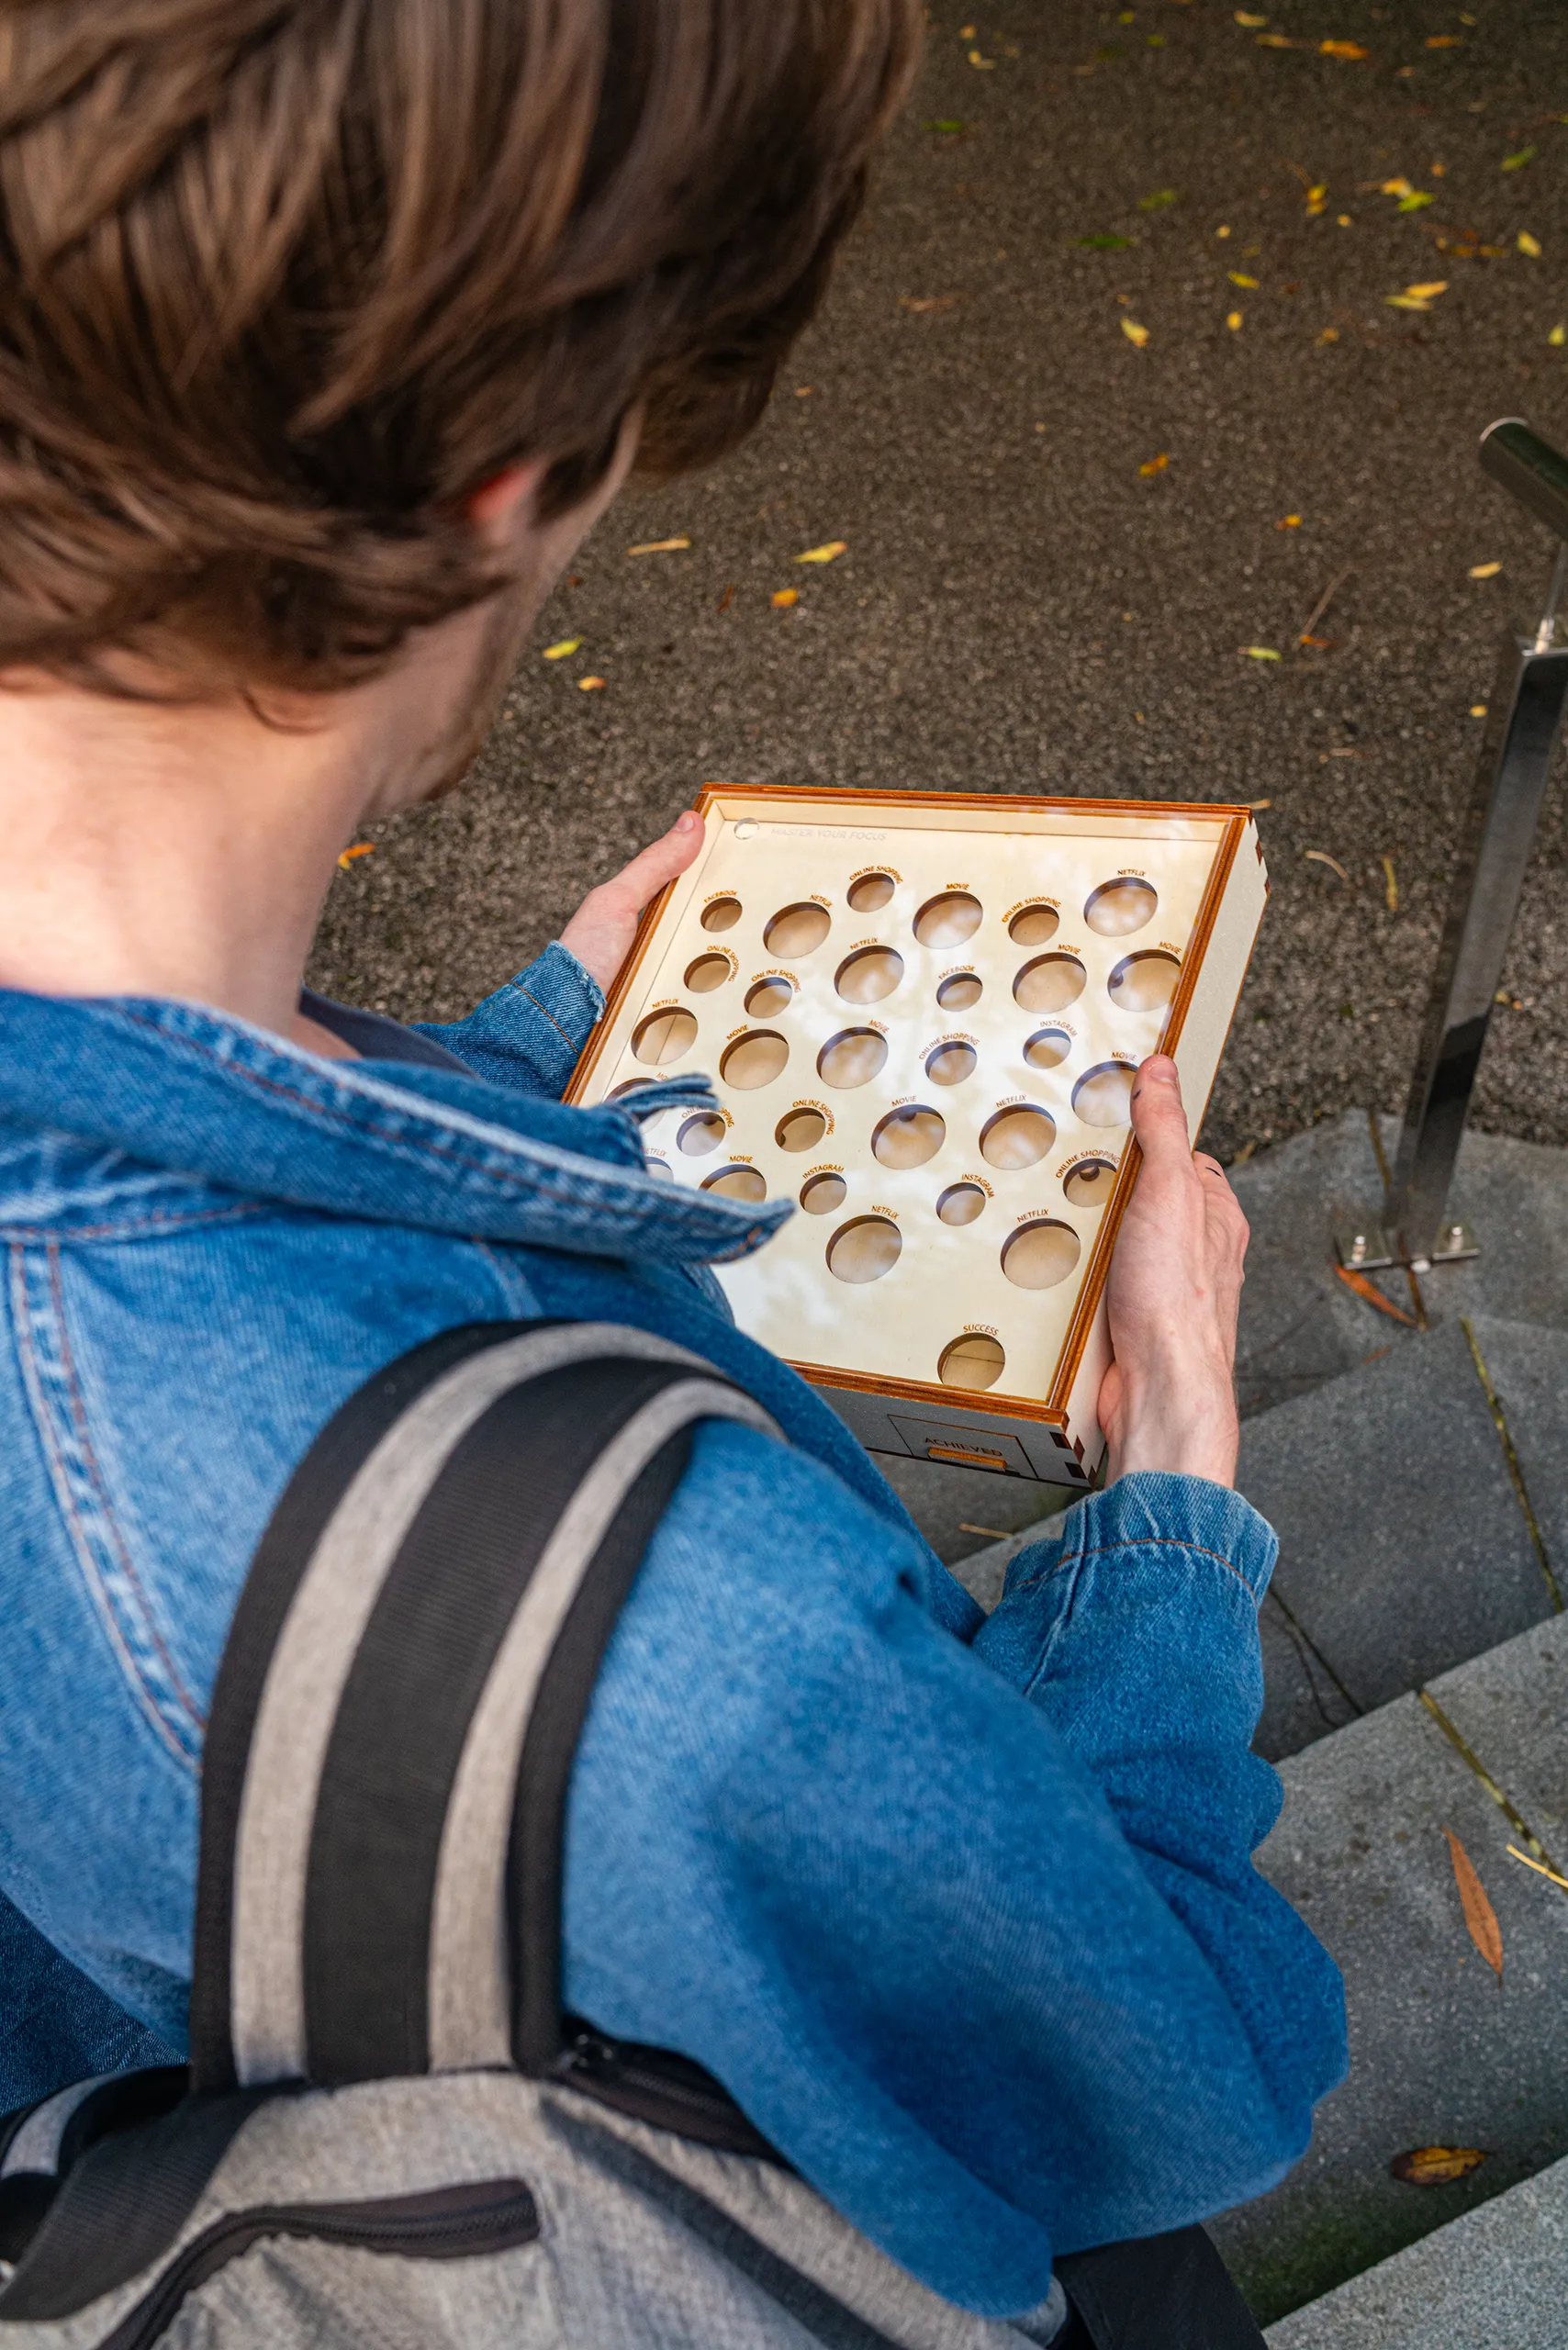
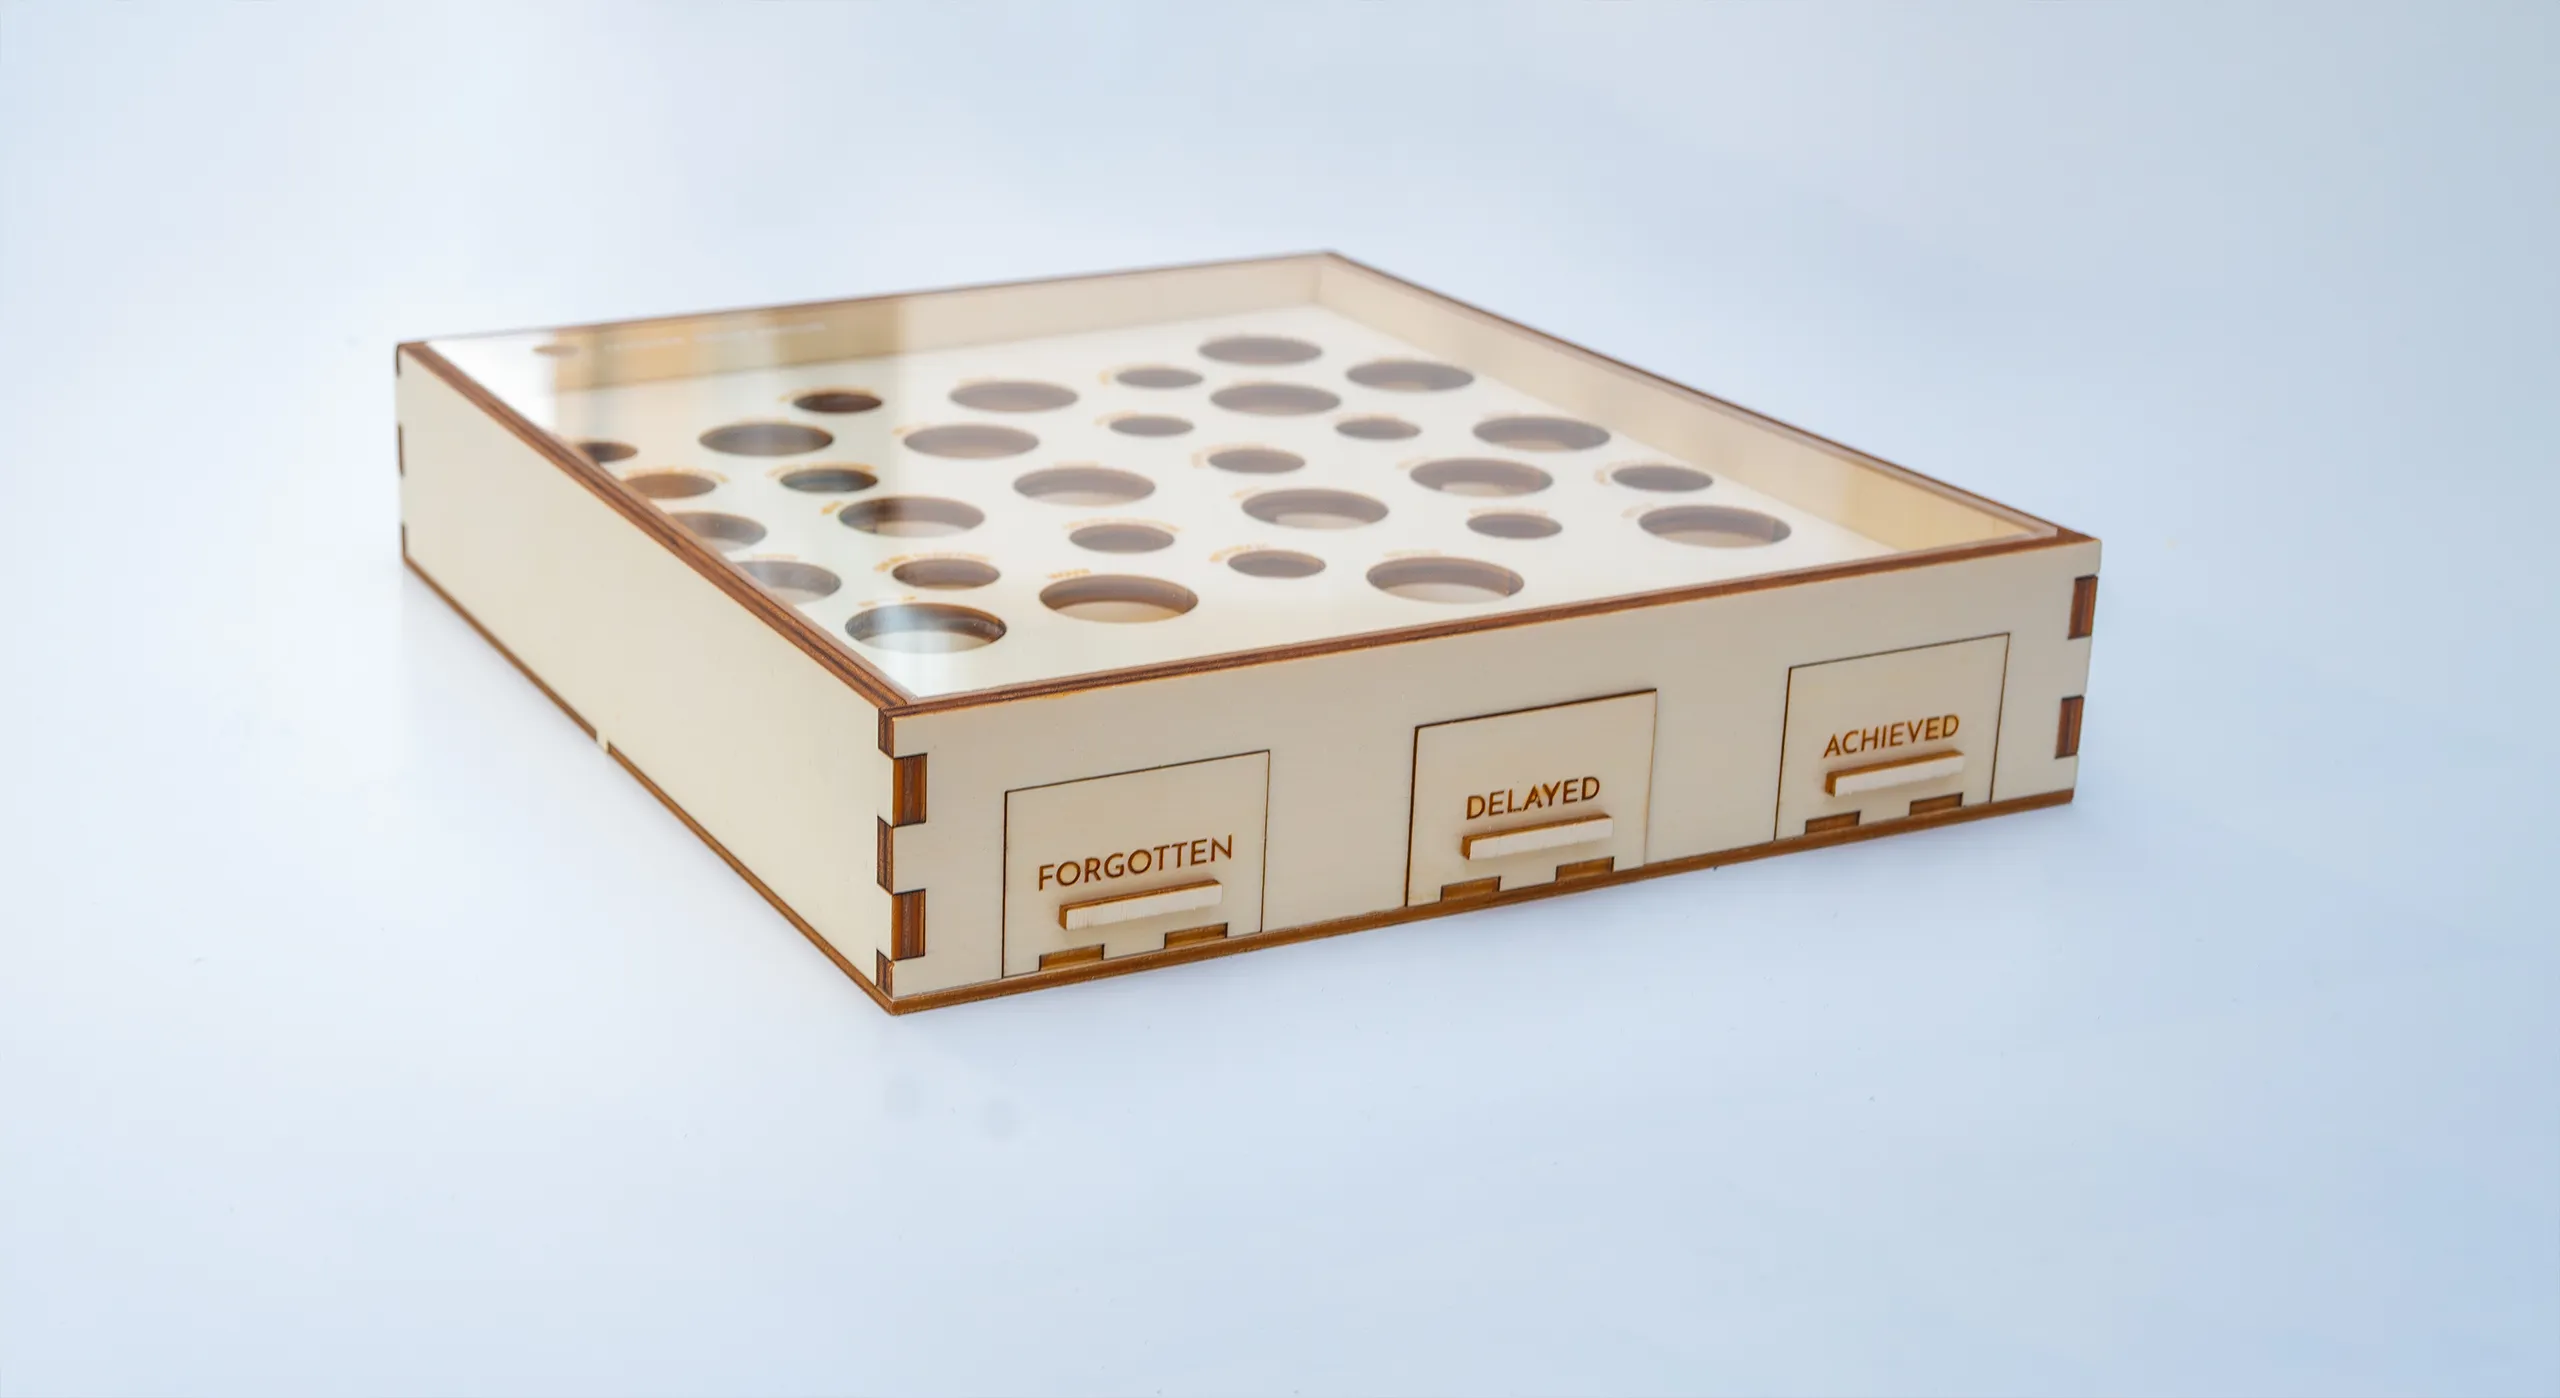
Master Your Focus is a board game and data visualisation built from one week of personal screen-time. The brief was self-set at the start of the MA: make your own attention data physical, confrontational, and impossible to scroll past. Every hour spent on a screen becomes a hole laser-cut into plywood — sized in direct proportion to the time spent. The board is a map of one week’s attention. You can put your hand through the biggest holes.
The first project of the MA, and the most personal. Eleven years of Montessori work — where abstract concepts become physical objects — turned inward on the question of where my own time was actually going.
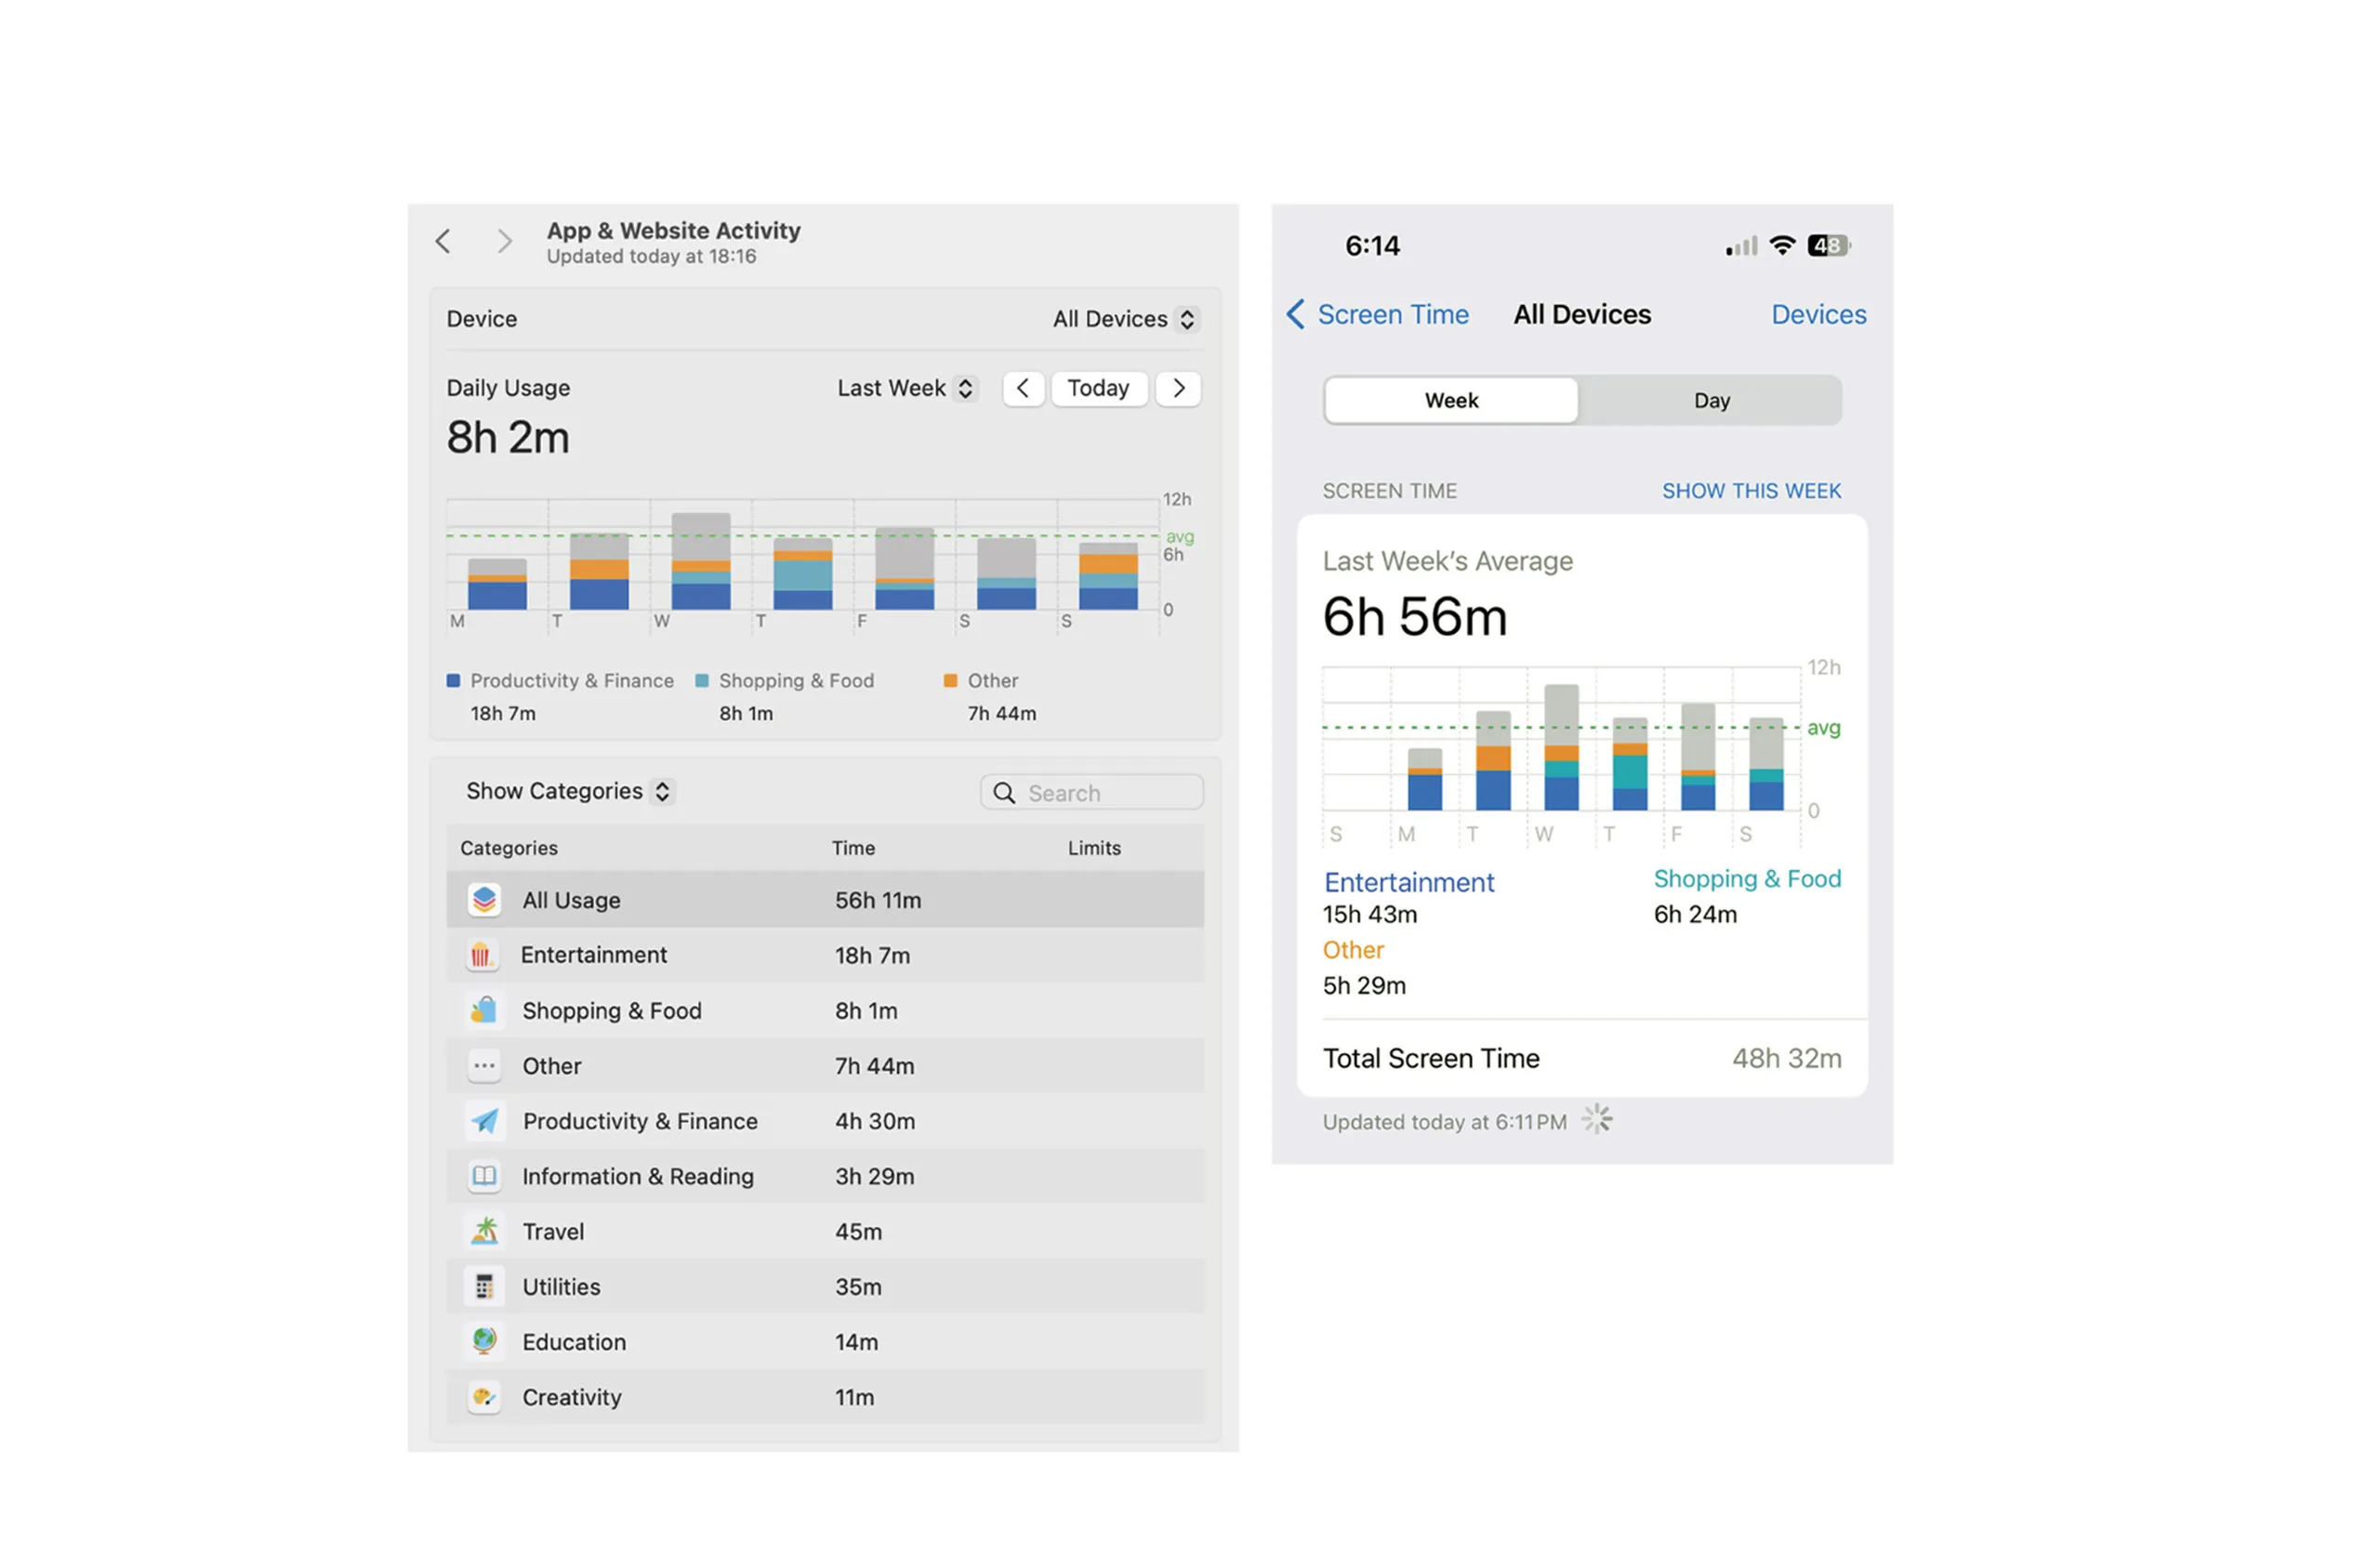
The average person spends 7 hours a day on screens, yet we lack any physical, tangible way to understand what that time looks and feels like.
The average person spends 7 hours a day on screens, yet we lack any physical, tangible way to understand what that time looks and feels like.
Average daily screen-time across all devices. That’s 49 hours a week — more than a full working week spent looking at glass.
Of people say they spend more time on screens than they intend to. The gap between intention and behaviour is the design space.
A board game and data visualisation that turns screen-time into physical space — the bigger the hole, the more time lost.
After eleven years in Montessori manufacturing, the MA began with a question turned inward: where does my own attention go? Screen-time data exists on every phone, but it lives as abstract numbers. The challenge: make that data physical, confrontational, and impossible to scroll past.
The brief was self-set: visualise one week of personal screen-time as a physical board game. The data must be felt, not read. This was the first MA module — a moment of self-reflection after 11 years in Montessori work.
The research drew on two fields: data physicalization (turning abstract data into tangible objects) and Montessori pedagogy (learning through material engagement). The intersection: if you can hold the data, you can reckon with it.
Data physicalization — turning numbers into tangible objects — emerged as the strongest approach. The precedent: Montessori materials, where abstract concepts become holdable, countable, movable. If a child can learn multiplication through wooden beads, an adult can learn attention through holes in a board.
Screen-time is a number on a phone. What if you could hold it?
Screen-time reports tell you the number. They never make you feel it. Seven hours is just a digit until it’s a hole you can put your hand through. The board doesn’t judge — it reveals.
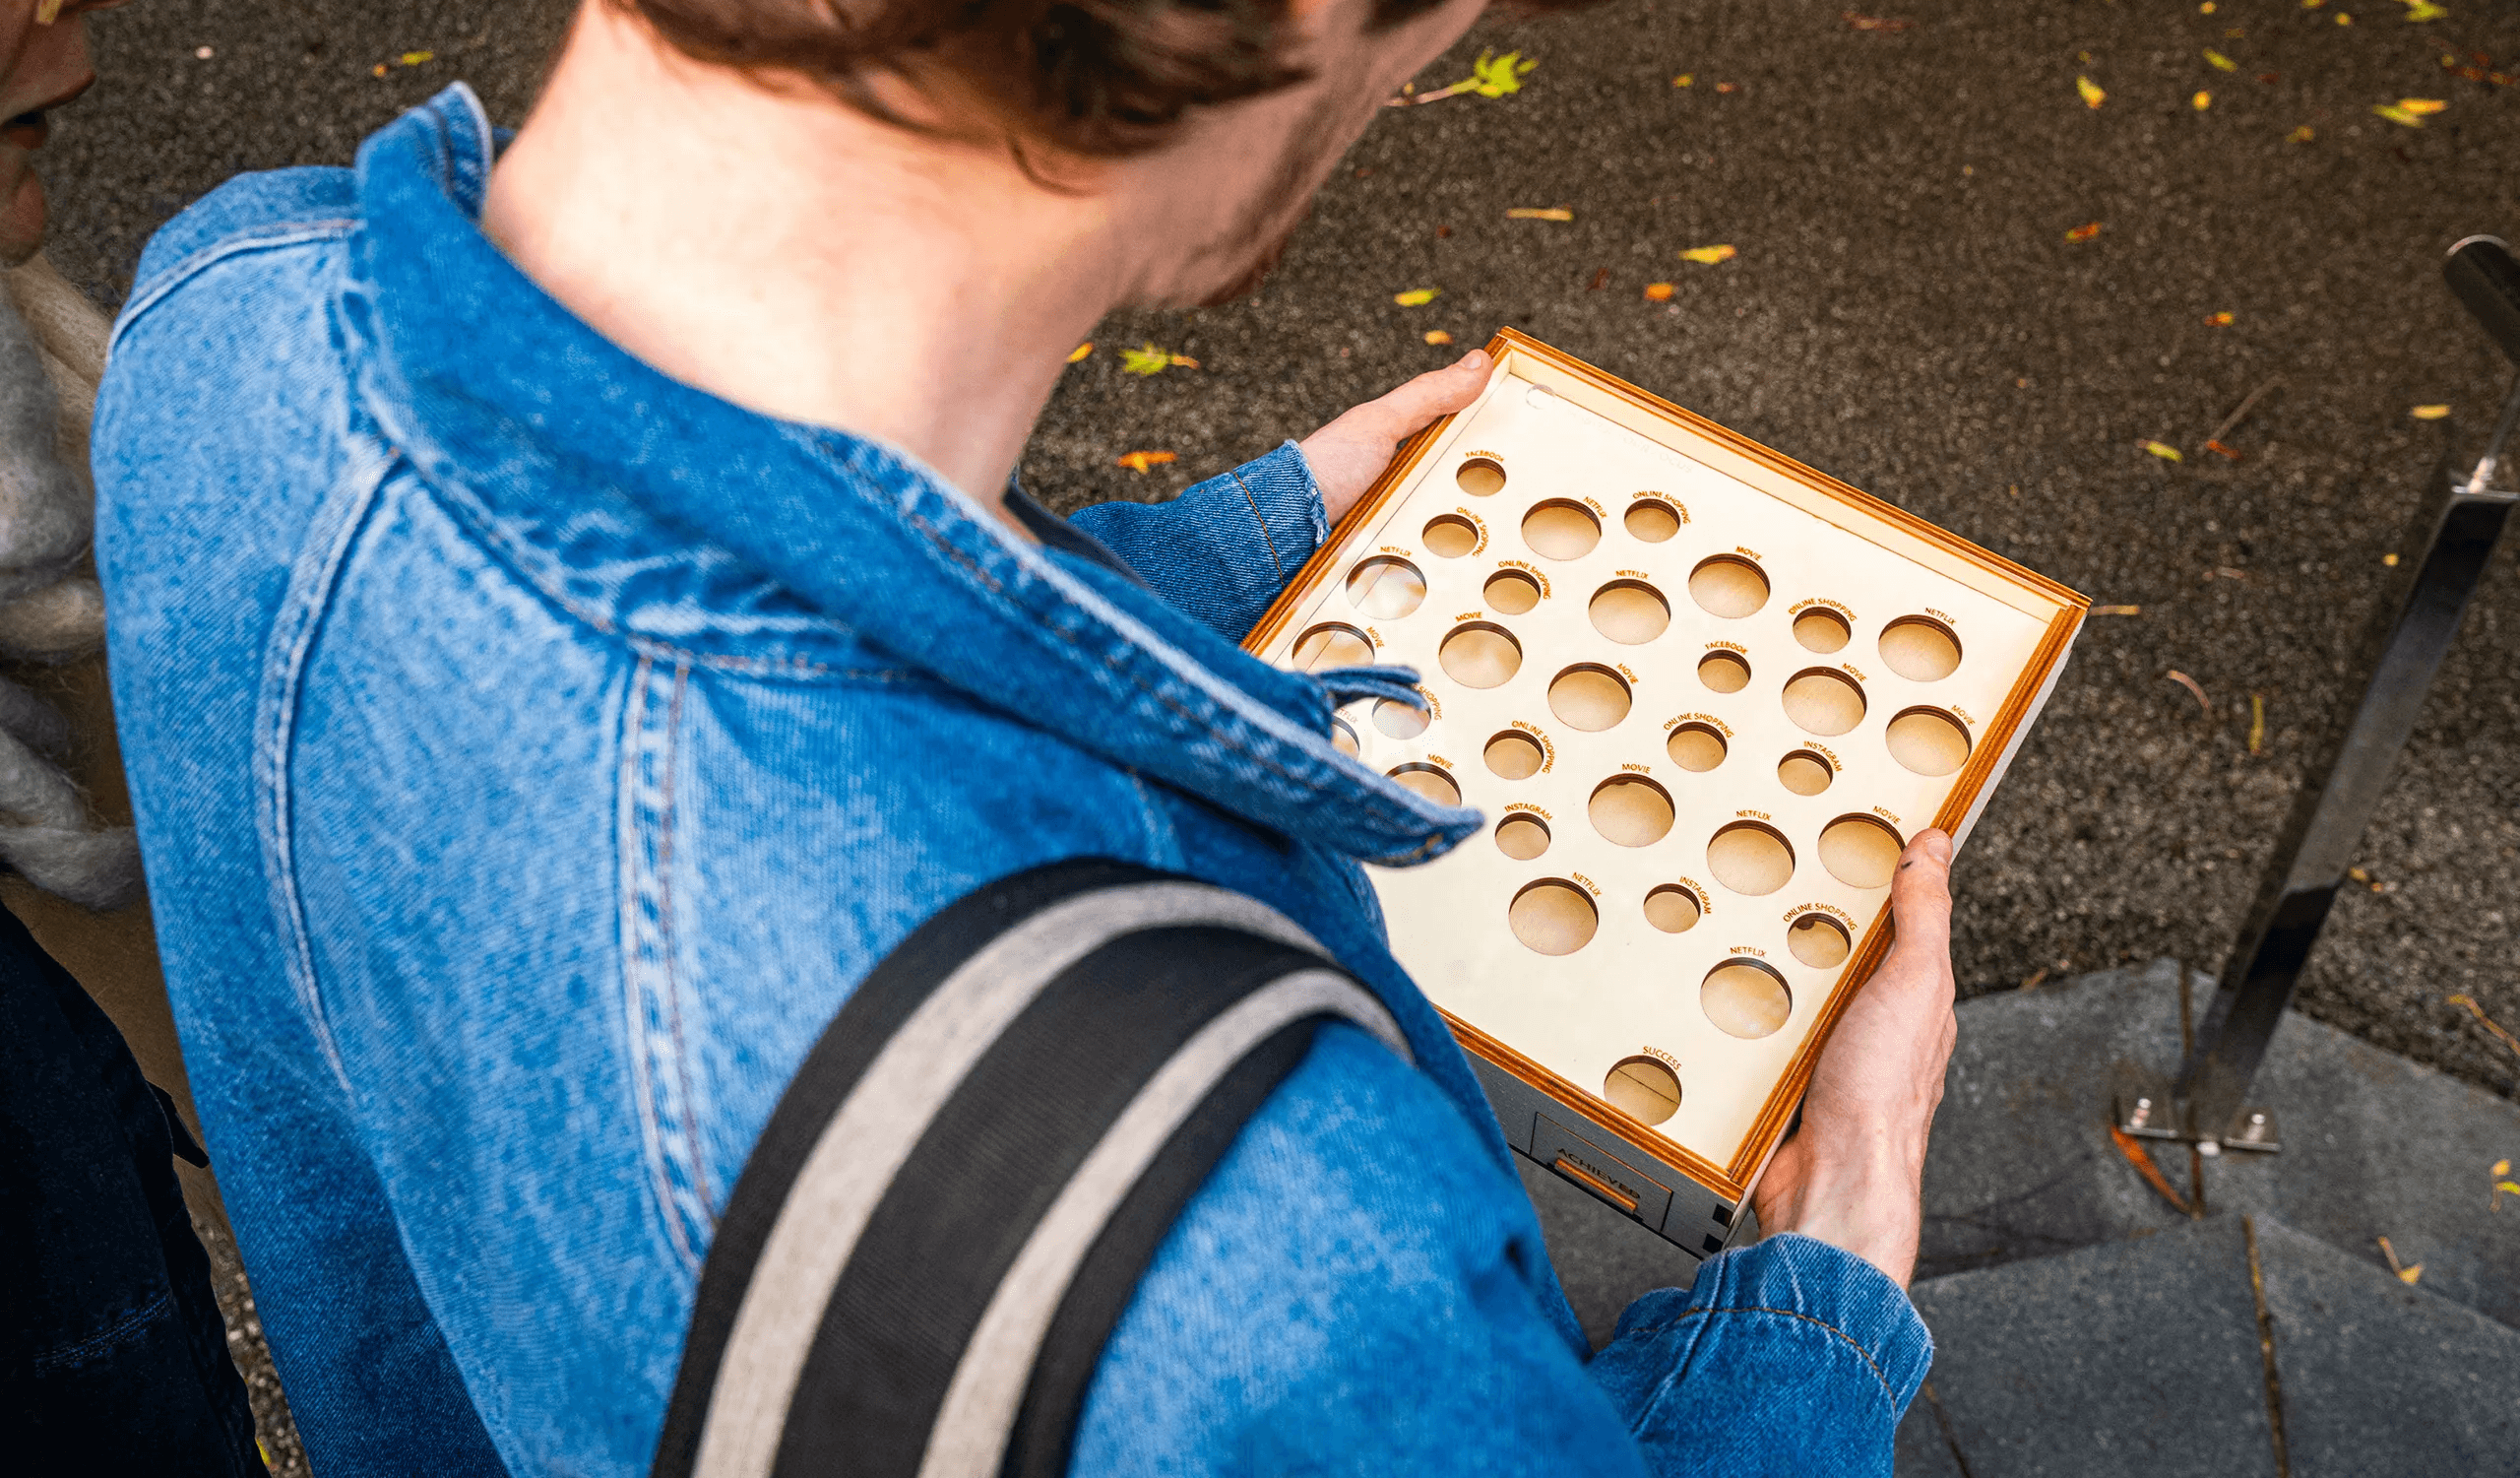
The hole in the board is the hour on the screen. Make the absence physical.
Screen-time is a number on a phone. What if you could hold it?
Screen-time reports tell you the number. They never make you feel it. Seven hours is just a digit until it’s a hole you can put your hand through. The board doesn’t judge — it reveals.
The hole in the board is the hour on the screen. Make the absence physical.
One week. One board.
See what you spend.
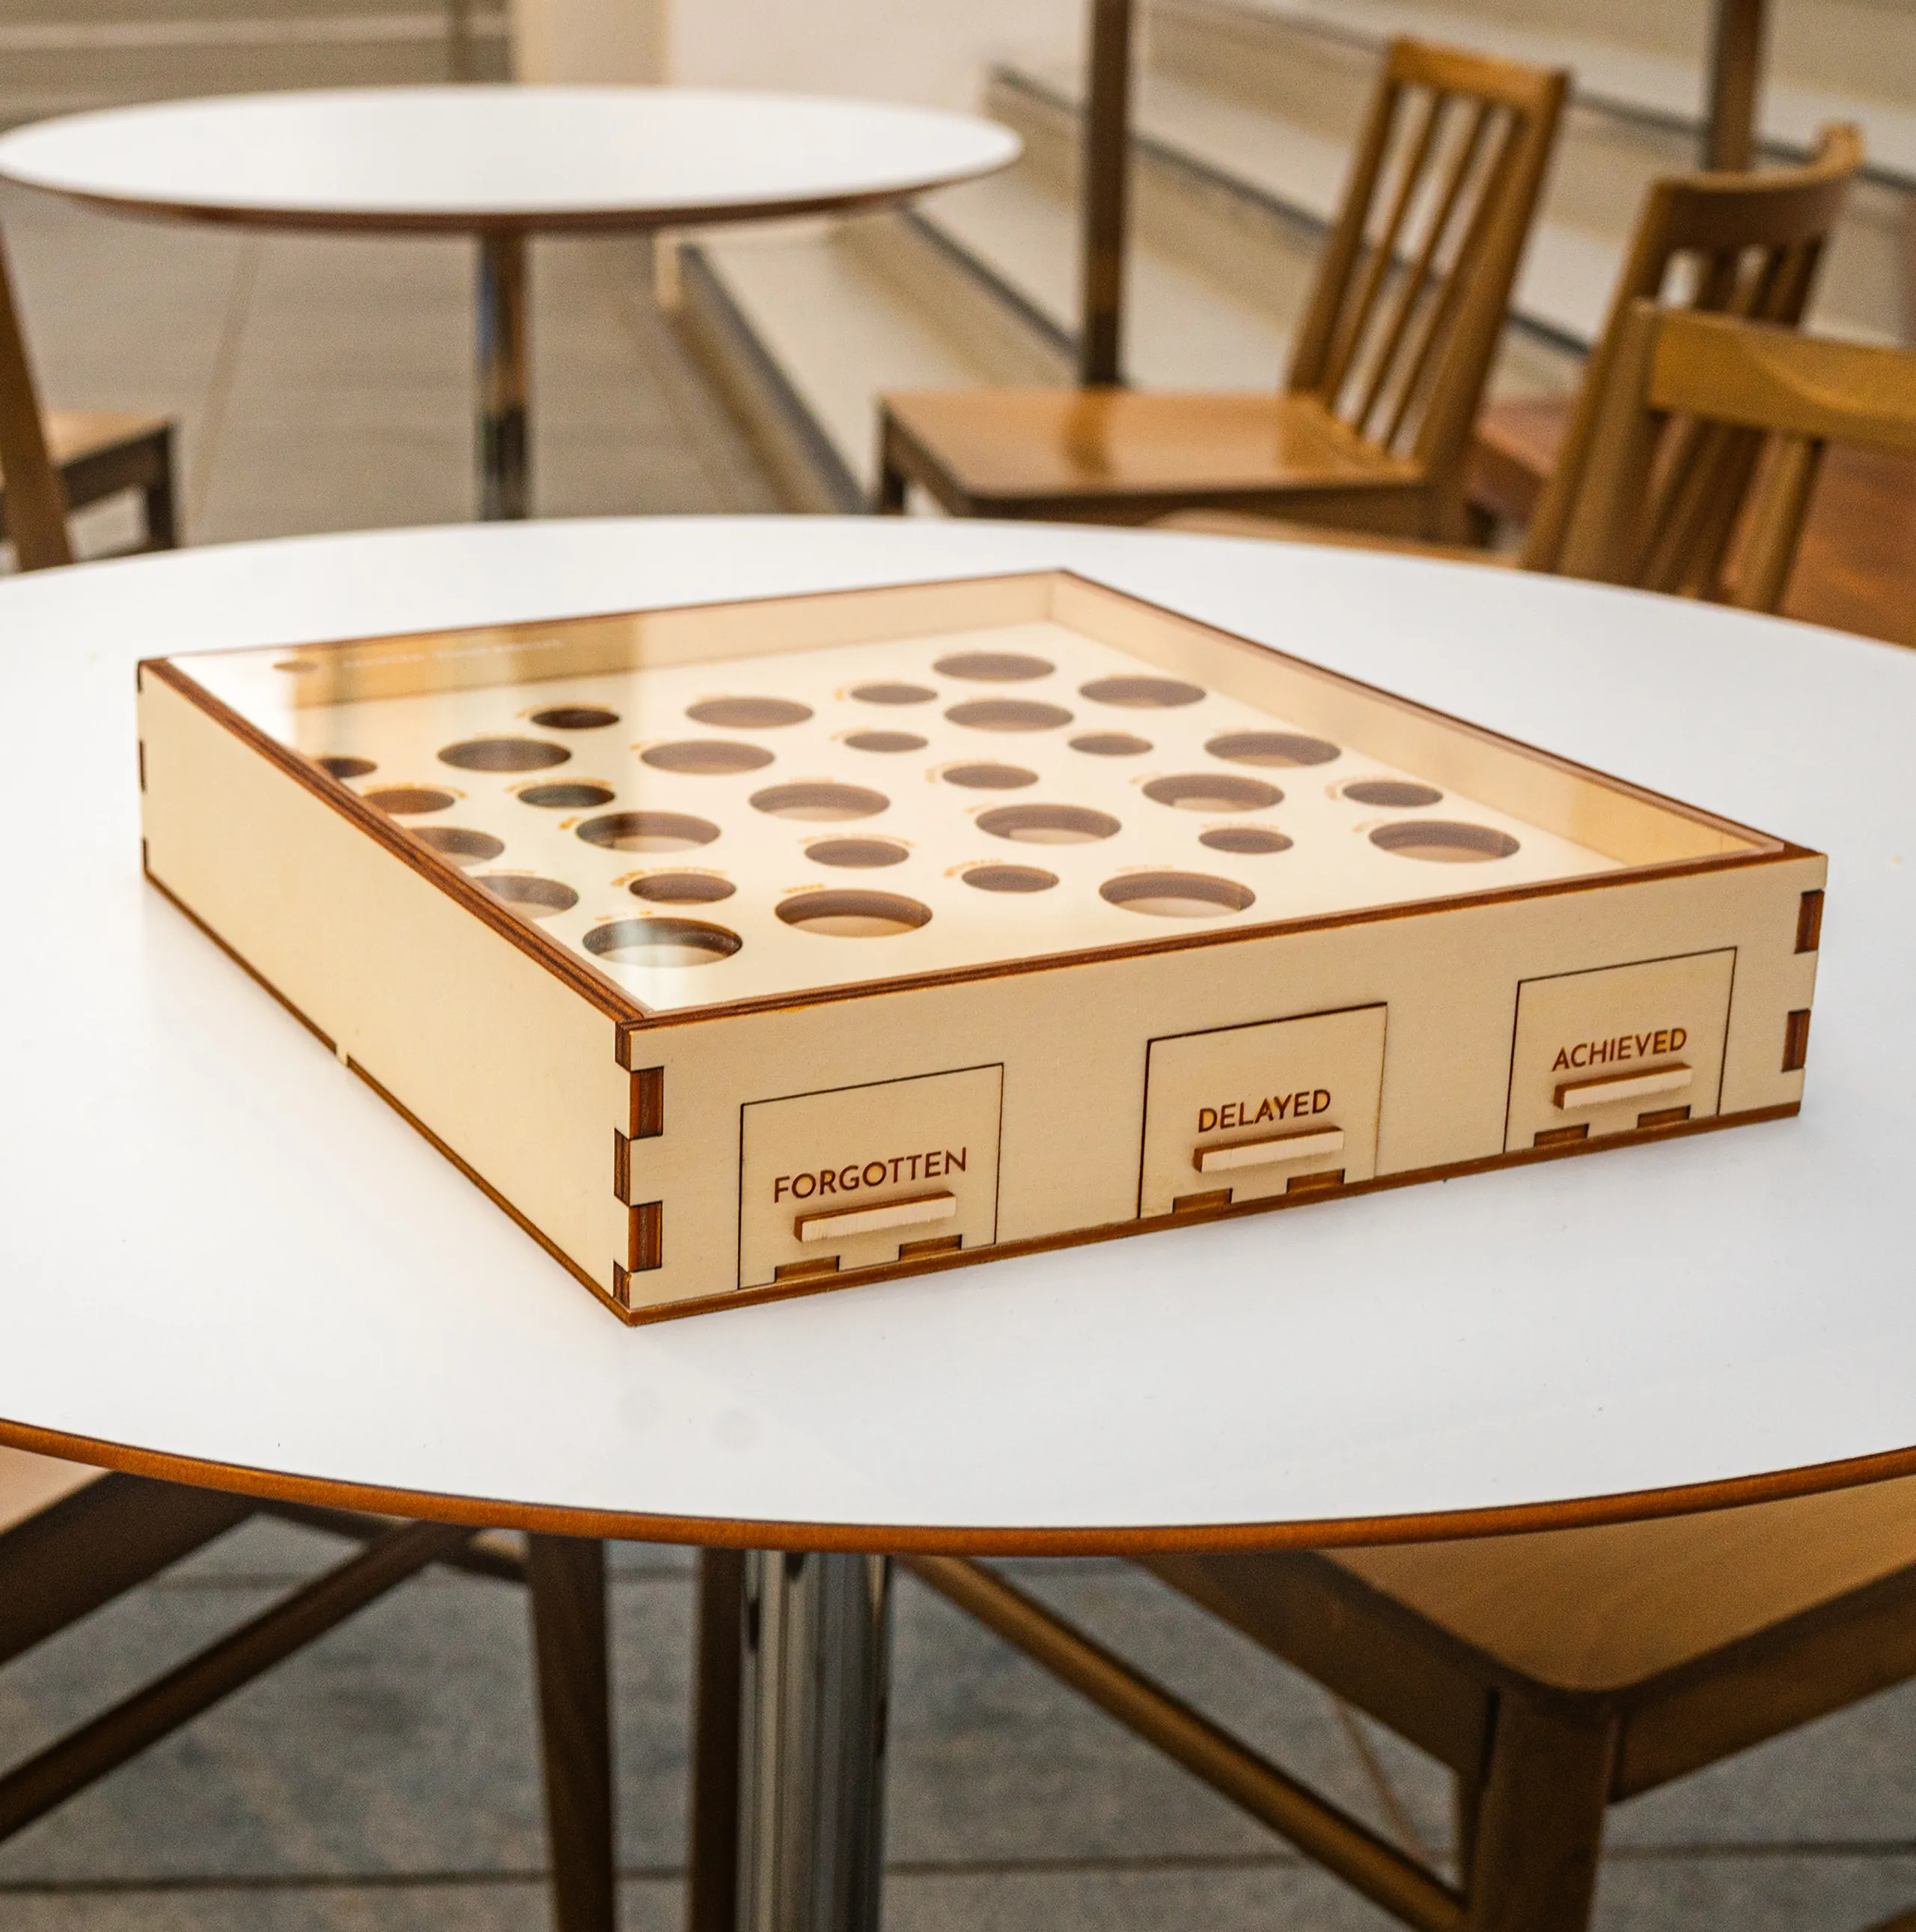
A board game built from one week of personal screen-time data. Each hour on a screen becomes a hole laser-cut into plywood — the bigger the hole, the more time consumed. The board is a physical map of attention, designed to be felt rather than read.
One week. One board.
See what you spend.
A board game built from one week of personal screen-time data. Each hour on a screen becomes a hole laser-cut into plywood — the bigger the hole, the more time consumed. The board is a physical map of attention, designed to be felt rather than read.
From brief to built
Seven days of personal screen-time data were logged manually: app by app, hour by hour. The raw numbers were then translated into physical dimensions — each hour of screen-time mapped to a hole size on the game board.
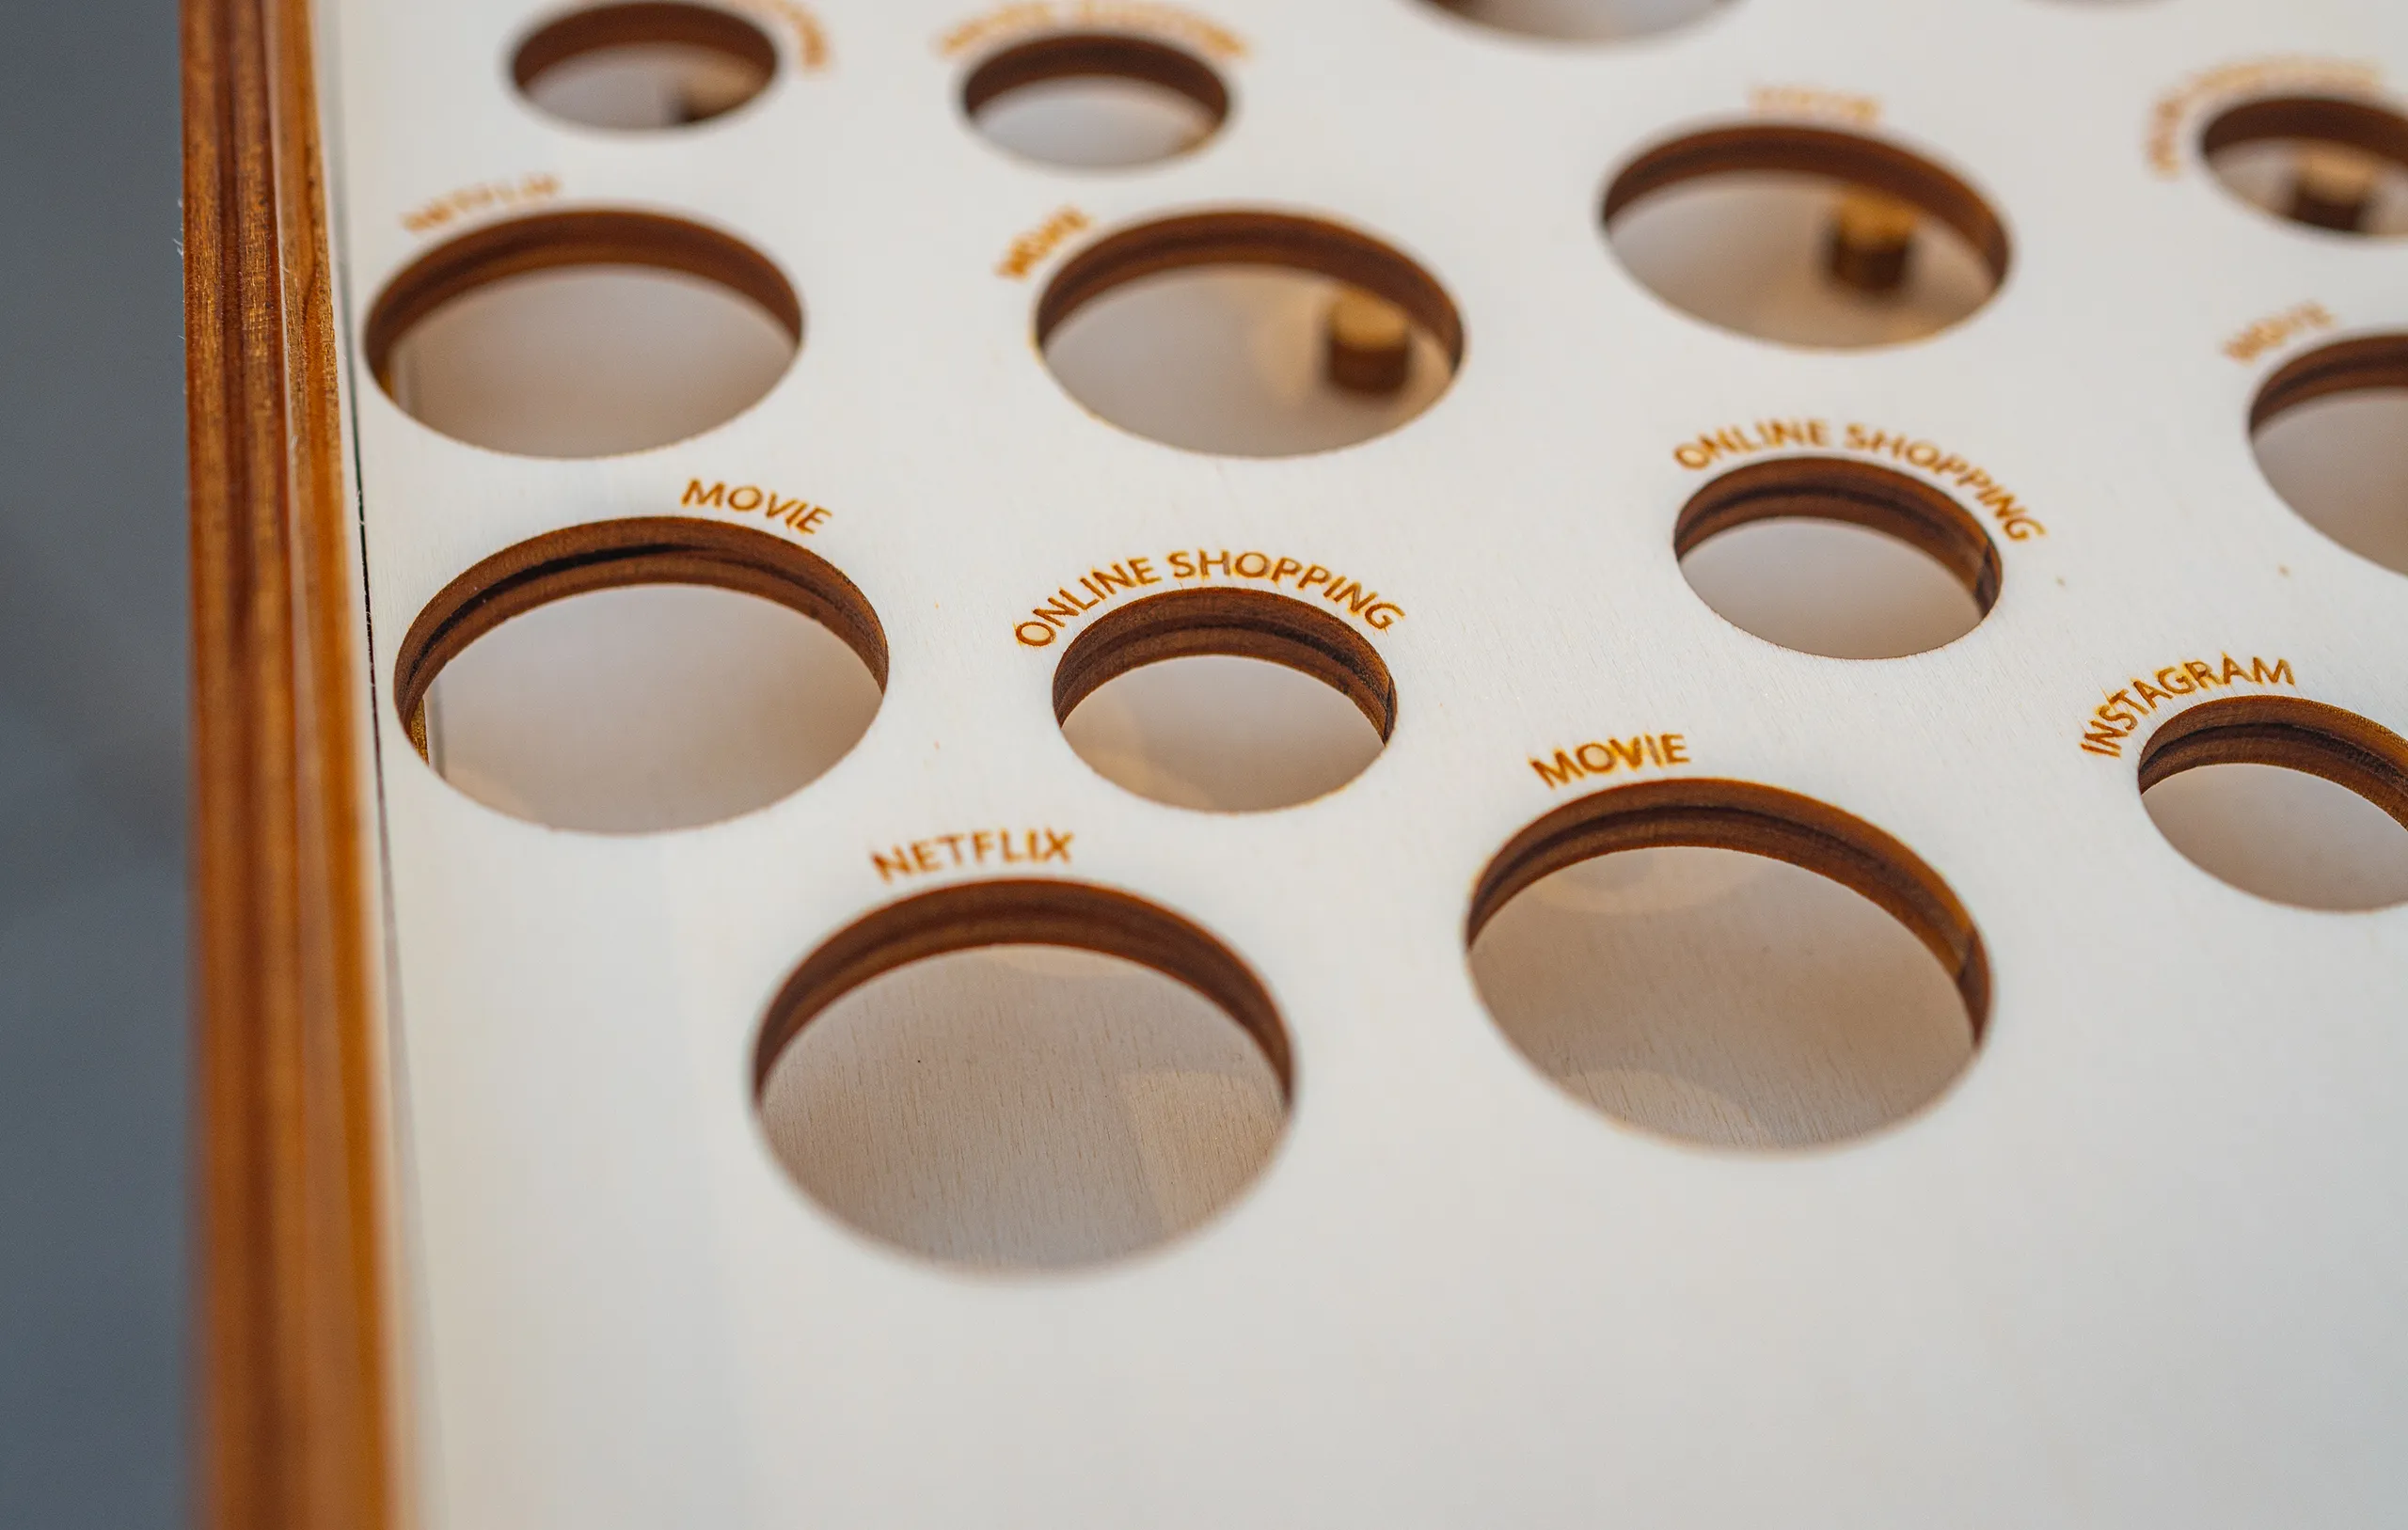
Holes were laser-cut into plywood at sizes proportional to screen-time: a 3-hour Instagram session becomes a 60mm hole; a 20-minute email check becomes a 12mm hole. The board is a physical map of one week’s attention.
A reflection journal accompanies the board — prompting the player to write about what they noticed, what surprised them, and what they’d change. The game isn’t competitive; it’s introspective.
From brief to built
Seven days of personal screen-time data were logged manually: app by app, hour by hour. The raw numbers were then translated into physical dimensions — each hour of screen-time mapped to a hole size on the game board.
Holes were laser-cut into plywood at sizes proportional to screen-time: a 3-hour Instagram session becomes a 60mm hole; a 20-minute email check becomes a 12mm hole. The board is a physical map of one week’s attention.
A reflection journal accompanies the board — prompting the player to write about what they noticed, what surprised them, and what they’d change. The game isn’t competitive; it’s introspective.


The data is personal. The confrontation is physical.
The data is personal. The confrontation is physical.
The confrontation was more specific than expected. When the board was finished, Netflix had one of the largest holes on it — not social media, not email. Netflix. Looking at that hole, the honest answer wasn’t that I enjoyed it. It was that I was using it to procrastinate. The board didn’t accuse. It just sat there with the evidence cut into it, and you had to decide what the shape meant. That gap between intention and behaviour is different for every person. The board doesn’t give you the same answer twice.
Take the board beyond personal data.
The natural next move is the uncomfortable one: put the board on the screen that created it. A digital version that pulls screen-time data directly from your phone and generates a personalised board — open the app, see the holes, close the app. The device becomes the evidence against itself. That paradox is the point. The physical version works because it’s removed from the device. The digital version would work because it’s not. Different discomfort, same reckoning.
The data is personal. The confrontation is physical.
The data is personal. The confrontation is physical.
The confrontation was more specific than expected. When the board was finished, Netflix had one of the largest holes on it — not social media, not email. Netflix. Looking at that hole, the honest answer wasn’t that I enjoyed it. It was that I was using it to procrastinate. The board didn’t accuse. It just sat there with the evidence cut into it, and you had to decide what the shape meant. That gap between intention and behaviour is different for every person. The board doesn’t give you the same answer twice.
Take the board beyond personal data.
The natural next move is the uncomfortable one: put the board on the screen that created it. A digital version that pulls screen-time data directly from your phone and generates a personalised board — open the app, see the holes, close the app. The device becomes the evidence against itself. That paradox is the point. The physical version works because it’s removed from the device. The digital version would work because it’s not. Different discomfort, same reckoning.
